4. How to collect EXAFS scan
To collect EXAFS scan from your protein crystal use any crystal for EXAFS but save the best crystal for diffraction data collection. The crystal for the EXAFS scan needs not be single, but the size matters. Metal foils can be also used for EXAFS to calibrate the energy or your support personnel may suggest the correct energy for your element, based on the previous EXAFS data.
Check the energy and/or move it manually (see above how to change energy) close to the desired edge. Mount the crystal, align it and arm the hutch as usual.
The full procedure of EXAFS is fully automated now: click on XAFS scan– the new window with periodic table will appear.

Choose your element and the desired edge (within the range of
6000-14000 eV). The system will change energy automatically, and it
will perform an autoalignment after EVERY energy change more than
500eV. Be patient, wait until it’s finished. Once
it’s done a new popup input window will appear – see Figure 9 below.
First, check that the fluorescent detector did move toward the sample, if not, click on “INSERT SDD DETECTOR” (The lowest button in the EXAFS popup menu – Figure 9)
Second, check that INITIAL ENERGY is close to the desired energy (~20 eV below the edge);. SCAN RANGE should be 40-50eV with energy step 0.5-1eV (don’t change INTEG TIME 5.0 and DAMP DWELL 200). In the DESC field put some info about your protein, type a new file name in the OUTPUT field (you will need it later for processing by CHOOCH); the file extension should be “.dat”
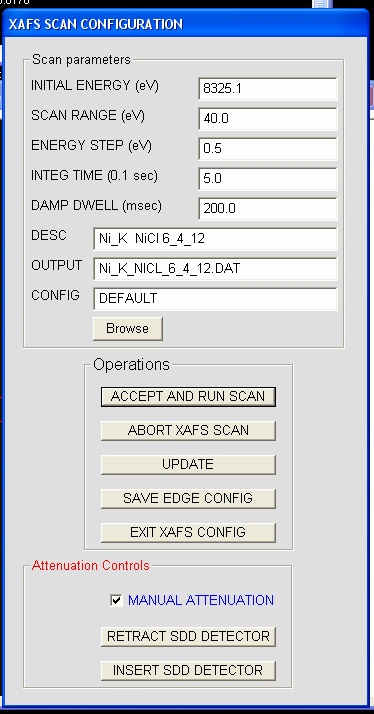
Figure 9. EXAFS parameters window; make sure it has correct initial
energy and output filename
Third, the
flux of the beam should be optimized at the peak energy (or slightly
above it) so that the fluorescent scattering from the crystal is not
overloading the “SDD DETECTOR” (on rightmost monitor- left side of
figure 10). Open the shutter (click on toggle
shutter in the lower portion of menu) and watch the counts
appear in the “SDD DETECTOR”. You want make sure that the counts are
in the range of 1-4 units, by adjusting the beam flux. Optimal counts
are around 2-3 as shown in the Figure 10 below.For ~100 micron crystal
at Se-edge (12662eV) 0.5% transmission is a good starting flux.
Adjust the transmission, if necessary. Close the shutter.

Figure 10. The view of the right most monitor of the beamline computer, illustrating proper flux for EXAFS
Forth, press ACCEPT AND RUN SCAN and next EXIT XAFS CONFIG. Hit ABORT XAFS SCAN if you change your mind (this is valid only after first point is measured). Another graphics window opens on the rightmost monitor, in a minute it will be showing the acquisition of real-time fluorescent signal (blue), very rough derivative of it (red) and the baseline flux (green). It takes ~3-5 minutes to collect 40eV scan and the crystal is irradiated for less than one minute. Once it's done (the system will announce “EXAFS energy scan complete”, close the graphics window by clicking on “MASTER OPS” and select “clear master XAFS NTGRAPH”. This menu also has a button to abort running XAFS scan.
Now click on “chooch”, select your previous file name for exafs scan, select the anomalous element and write down the calculated inflection point, peak energy and the values for f’ and f’’. (note that for the very noisy exafs scan the results could be incorrect, always compare calculated value with the real fluorescent scan). You may annotate both experimental and calculated plots (click on any point and press “annotate” and print the graph in a landscape orientation.
Change the beam flux back to the appropriate value for data collection. Use your preferred strategy to collect MAD data (like - peak energy first, inflection point next and finally -remote energy); for SAD data collection move energy to the peak value.
Note 1: Do NOT open the hutch door or close the main shutter, if the system is changing energy or doing EXAFS. This may results in the mechanical damage to MD2 and the beam may be lost
Note2: Do NOT try to collect EXAFS scan from mercury containing proteins, as the Hg white line is extremely broad. Use any energy above 12310 eV to collect “peak” Hg data.